|
Original Data
The environmental analysis phase of Vision: Frontera began with an evaluation of existing data sources and maps. We
tried to collect
as many maps, GIS files and aerial photos as possible. Institutions contacted
included the U.S. Geological Survey (USGS), Texas Natural Resource Information
System - Borderlands Information Center (TNRIS), Texas Natural Resource
Conservation Commission (TNRCC), Texas Department of Transportation (TxDOT),
University of Texas Libraries, International Boundary Waters Commission (IBWC),
the Fideicomiso
para el Desarrollo Norte del Estado de Nuevo Leon (FIDENOR),
and others as well.
We
started with Mexican natural resource thematic maps from the Dirección
General de
Estudios del Territorio Nacional (produced between 1978 and 1982). In
general, these maps served as a reference source for primary data
analysis. The names of the map series are as follows:
| Map Theme |
Map Name |
| Geology |
Carta Geológica
Villa Hidalgo G14A17, 1979 |
| Soils |
Carta Edafológica
Villa Hidalgo G14A17, 1978; Colombia G14A27, 1978 |
| Vegetation/Land Use |
Carta de Uso del Suelo y Vegetación
Villa Hidalgo G14A17, Colombia G14A27 |
|
Source: Secretaria de programación y
presupuesto, Coordinación general del sistema nacional de information,
Dirección general de Estudios del Territorio Nacional, San Antonio Abad No.
124 Mexico 8 D.F. |
We worked in teams to analyze the maps and determine their extent and
limitations, and then developed strategies for field verification and additional
data collection.
We
also ordered an overlapping, stereoscopic set of black and white aerial photos
[April 1994, 1:24,000 scale] from TxDOT,
which were enlarged and then scanned at a useful high resolution (600 dpi). Their on-land
resolution is about 0.4 meters per pixel, which
allows very close levels of examination.
Another
source of aerial imagery was the USGS which produces Digital
Ortho Quarter Quadrangles (DOQQs). These images are so named
because they have been orthographically rectified and they each cover the
area of one quarter of a 7.5 minute USGS quadrangle map. The main advantages
of the
DOQQs are as follows: they were flown in the summer of 1997 -- more recently than the black and
white aerials; they are color infrared images (they are useful for
determining vegetation types and densities); and they have been
"rectified," a complicated process that eliminates spatial distortions
common on aerial photos, caused by
elevation differences, in-flight variations, and curvature of the camera lens.
These
images have an on-land
resolution of approximately 1 meter.
Digital
Data Capture Method
In
order to prepare data for accurate mapping, we defined a set of fixed,
absolutely georeferenced "control points" that could function as anchors for all data that
would be added duri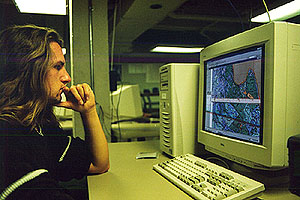 ng the project. For this purpose, we defined several distinctly
recognizable ground features like road intersections, borderlines, houses, etc.
that were recognizable on the 1978 Mexican maps, aerial imagery, and all other
maps. We digitized these points with their absolute longitude and latitude
locations using a CalComp digitizing table, with the "Digitizer" extension of
ESRI's ArcView software. ng the project. For this purpose, we defined several distinctly
recognizable ground features like road intersections, borderlines, houses, etc.
that were recognizable on the 1978 Mexican maps, aerial imagery, and all other
maps. We digitized these points with their absolute longitude and latitude
locations using a CalComp digitizing table, with the "Digitizer" extension of
ESRI's ArcView software.
The
control points were used to align scanned aerial photographs with the help of
the ArcView "Image Analyst" extension (in a process called "rubber
sheeting")
so that these images would be georeferenced. Using the georeferenced images, we
could then digitize from the computer screen using the "heads up
digitizing" method, instead of using the digitizing tablet. [Click
here for heads-up digitizing instructions.] This procedure allowed us to
produce digital versions of the 1978 maps showing vegetation and land use, soils, geology,
topography, hydrologic features and
manmade features. Using ArcView GIS software, then, each thematic map could
be displayed as a theme and
used as an overlay to create multi-themed maps. This digital thematic
information was displayed on a background of the aerial imagery, which had been
scanned and georeferenced.
Data Collection and Mapping Methods
In order to verify data from the 1978 maps and collect additional data, we made two field visits to Rancho San Eduardo. The first trip
(February 25-27, 2000) was devoted to exploratio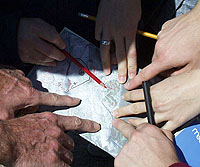 n of the study area and
preliminary data collection, with
attention focused on how best to collect specific data. The second trip
(March 10-13, 2000) provided an opportunity to do extensive data collection and
field-based an n of the study area and
preliminary data collection, with
attention focused on how best to collect specific data. The second trip
(March 10-13, 2000) provided an opportunity to do extensive data collection and
field-based an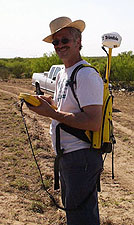 alysis. In the field, printouts of the digital maps,
photocopies of the original Mexican maps and photocopies of aerial
photographs were used for orientation and recording of collected data.
Class members worked in teams to collect data and verify items
noted on the 1978 maps. In addition to general observation and sampling
strategies, fieldwork was supplemented with the use of a Trimble GeoExplorer 3
global positioning system (GPS)
unit. This top-of-the-line equipment can produce digital maps with an
accuracy of one to five horizontal meters and two to ten vertical meters.
On the second field trip, a more advanced Trimble-XRS GPS was used, with a
sub-meter horizontal accuracy and vertical accuracy of one to two meters. Many
topographical and line features (highways, ranch roads, perimeters of
water tanks) were traversed to collect GPS data. Point features such as
buildings, soil and vegetation sample locations, and water features were also collected using the GPS
unit. alysis. In the field, printouts of the digital maps,
photocopies of the original Mexican maps and photocopies of aerial
photographs were used for orientation and recording of collected data.
Class members worked in teams to collect data and verify items
noted on the 1978 maps. In addition to general observation and sampling
strategies, fieldwork was supplemented with the use of a Trimble GeoExplorer 3
global positioning system (GPS)
unit. This top-of-the-line equipment can produce digital maps with an
accuracy of one to five horizontal meters and two to ten vertical meters.
On the second field trip, a more advanced Trimble-XRS GPS was used, with a
sub-meter horizontal accuracy and vertical accuracy of one to two meters. Many
topographical and line features (highways, ranch roads, perimeters of
water tanks) were traversed to collect GPS data. Point features such as
buildings, soil and vegetation sample locations, and water features were also collected using the GPS
unit.
Data and Maps Produced
Once fieldwork was completed, the teams began
analyzing field data, comparing it to the original maps. After
importing the GPS data into ArcView, however, it was noted that field GPS data
didn't line up accurately with the georeferenced aerial imagery. This
problematic
disparity was diagnosed as a map projection problem, with the GPS data having been
collected using a different projection system
(Universal Transverse Mercator zone 14, 1927 North American Datum) than the DOQQs (UTM zone 14, NAD 83). Skillful analysis led to a reprojection method
using the ESRI
extension "Projection Utility" for ArcView. [Click
here for reprojection instructions.] This proved to be a successful
remedy, as reprojected files matched perfectly with the DOQQs. In
order to reach a level of alignment approaching the U.S. National Mapping
Standards of
accuracy, the aerial imagery as well as the digitized feat ures were also
re-aligned to match the DOQQs. The result is an on-land deviation of no more
than 10 meters, which is about double the quality required in the standards
for map accuracy at the scale of 1:24,000. ures were also
re-aligned to match the DOQQs. The result is an on-land deviation of no more
than 10 meters, which is about double the quality required in the standards
for map accuracy at the scale of 1:24,000.
With all digital files properly
re-projected, the teams began to review changes in the study area from 1978 to
2000, based on differences between the early maps and the current
fieldwork. Each team recorded updated characteristics for the study
area, codifying the current environment in map format using ArcView GIS methods.
This process is described in much more detail in the Data
Collection and Analysis Methodology section. You can use the links
below to jump straight to its various subsections.
[Topography]
[Geology and Geomorphology] [Soils]
[Land Cover and Vegetation]
[ Roads] [Water Resources]
[Cultural Features] [Land
Uses and Practices] [Home]
|