 | ||
|
|
[Background][About the Study Area][Analysis Process][ Suitability Assessment][Home] | |
|
Introduction Using our field data and updated 2000 maps/shapefiles, we created a series of spatial models to produce useful information about the study area's inherent suitability for agriculture, human settlement and preservation. The following sections discuss the modeling process, including qualitative assumptions and quantitative techniques necessary to achieve meaningful results. [Modeling Tool] [Agriculture] [Human Settlement] [Preservation] [Results] [The Next Step] Spatial Modeling as an Analysis Tool A GIS-Model is a collection of processes performed on spatial data that produces information, usually in the form of a map. One may use this map for education, decision making, scientific study, and to provide general information. Each process in a model has three components: input data, a function that transforms the input data or derives new information from it, and the output data that the function creates. For this project, input data was digitized from maps and collected in the field. ArcView's ModelBuilder extension performed the transformation functions, and the output data was created in shapefile format. Spatial
models can do the following:
A more complex spatial model may combine quantitative information (for instance, how far away is something or how much does it cost) with qualitative information (for instance, how desirable is something or how important is it). We established inputs and values for each theme within the model. See the specific model descriptions below to view the algorithm used for each. The algorithm consists of input themes, percent influence, input labels and scale values. The following definitions refer to all three model algorithms depicted in table format below.
The
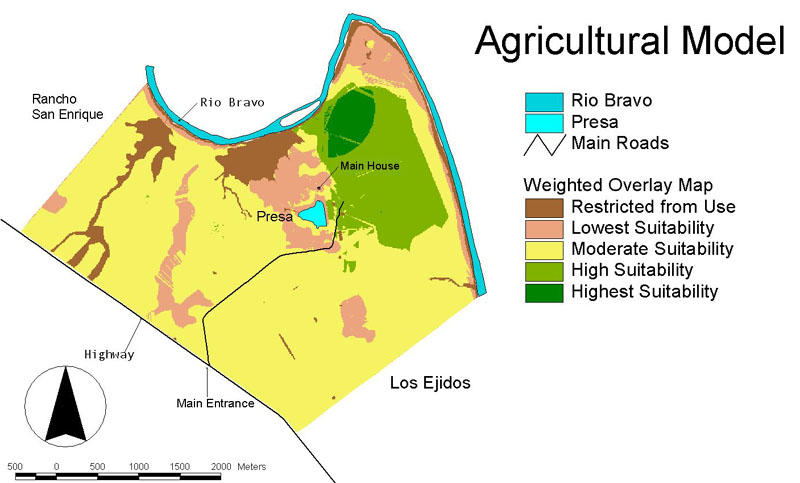
Agricultural Suitability Model Next,
access to water came into play. At
first we thought the mere proximity to a water source would be considered.
But then we realized that the capacity of the water delivery system
needed to be taken into consideration. Hence
a "sub-model" was created which assigned values to both the proximity
and the delivery capacity of the water source (depending on elevation) using
Boolean logic of if-then scenarios. For
example, if an area (grid cell) of land was at an elevation below a gravity flow
earthen acequia it was assigned a higher value than an area of land that had an
elevation higher than the same acequia. Each
delivery system was rated accordingly including acequias (both concrete and
earthen) center-pivot irrigation systems, wells, and a large water reservoir. Slopes
were included in the model. Flat
slopes are more conducive to agriculture in an area that is periodically
affected by flash flooding and erosion, therefore steep slopes were given a low
value. So too were areas that would
be difficult to cultivate due to the vegetation already present. Here we were specifically thinking of several areas of heavy
mesquite which is famous for its difficulty of removal. Finally
we considered the areas already developed with buildings as being unsuitable for
use as agriculture. The
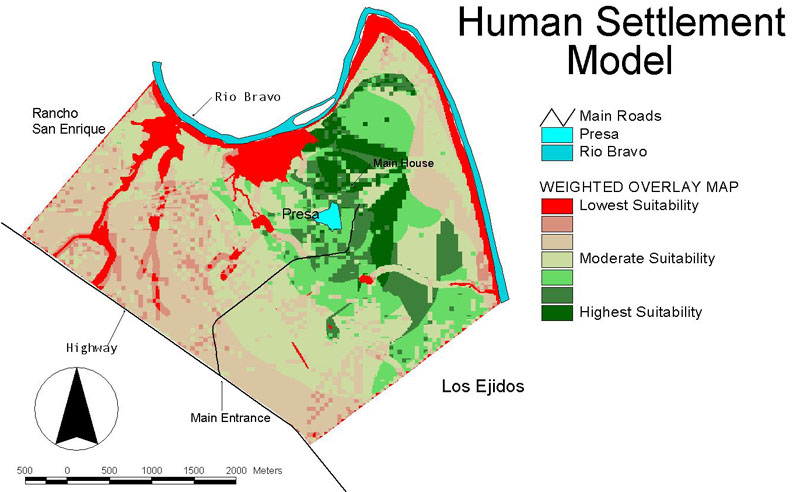
Human Settlement Suitability Model There
was discussion about how to evaluate the floodplain because of the nature and
location of the river terraces. The
field research revealed that the terraces had been flooded in recent time as
witnessed by extensive debris in these areas.
The 100-year floodplain map,
however, showed floodplains extending well beyond the terraces into areas
considerably higher in elevation. We
chose not to exclude these areas but assign them a suitability value one-half of that of the area
outside the floodplain. In
such situations in the United States,
a home owner would be obliged to purchase flood insurance. Finally
somewhat like the agricultural model, proximity and elevation in relation to
water infrastructure were evaluated and valued. The
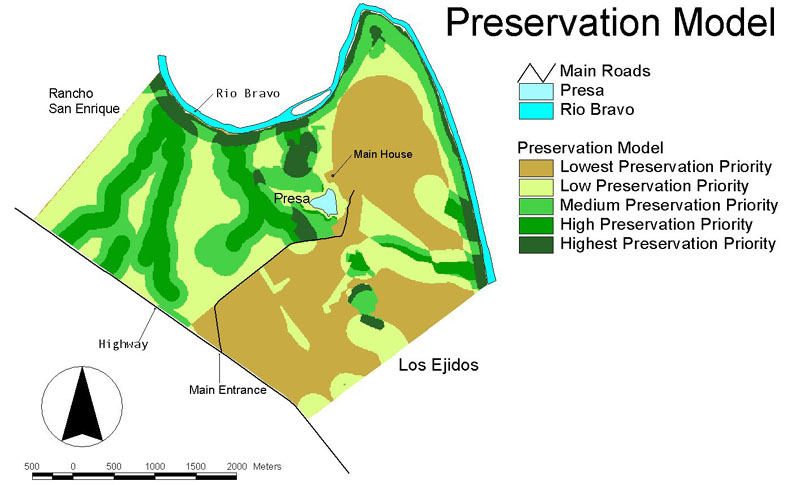
Preservation Suitability
Model Finally, there were several cultural features that merited consideration for preservation. The ruins of an old house located in the southeast quadrant of the ranch property were assigned special value, as was an area with a high concentration of Indian arrowheads and flints. Refer to the model-building methodology for a technical description of how this was accomplished using the ArcView ModelBuilder extension and a flowchart depicting the algorithmic process used to convert shapefiles into preservation suitability results. Results |
 ents. Minimum soil depth
is an obvious necessity for agriculture. However, not just any soil is ideally
suited for agriculture. The percent of organic matter in the soil, the ability of the soil to drain, and
the ability of the soil to release nutrients to a growing plant (cation exchange
capacity) were also taken into account. Staying
away from areas prone to erosion was also important and was represented in the
model.
ents. Minimum soil depth
is an obvious necessity for agriculture. However, not just any soil is ideally
suited for agriculture. The percent of organic matter in the soil, the ability of the soil to drain, and
the ability of the soil to release nutrients to a growing plant (cation exchange
capacity) were also taken into account. Staying
away from areas prone to erosion was also important and was represented in the
model. Soil depth came into consideration here because of the engineering
involved in home construction, so deeper soil was given a higher value than
shallower soil. Also we wanted to preserve the areas of rocky outcrops, areas
with little or no soil, not only for the engineering problems they might pose,
but for their scenic beauty.
Avoiding the southern exposure was considered critical in this arid
climate where few tall trees are available for shading from harsh sun.
Soil depth came into consideration here because of the engineering
involved in home construction, so deeper soil was given a higher value than
shallower soil. Also we wanted to preserve the areas of rocky outcrops, areas
with little or no soil, not only for the engineering problems they might pose,
but for their scenic beauty.
Avoiding the southern exposure was considered critical in this arid
climate where few tall trees are available for shading from harsh sun. higher
plant diversity was valued for its uniqueness alone.
Livestock tanks and the one area of wetlands around the large water
reservoir were
also valued according to their ability to attract wild life and nurture water
loving herbaceous plants. Arroyos
were valued because of their generally larger percentage of vegetative cover and
ability to provide shady microclimate.
higher
plant diversity was valued for its uniqueness alone.
Livestock tanks and the one area of wetlands around the large water
reservoir were
also valued according to their ability to attract wild life and nurture water
loving herbaceous plants. Arroyos
were valued because of their generally larger percentage of vegetative cover and
ability to provide shady microclimate.
|
Human Settlement Suitability |
|
Preservation Suitability |
|
The Next Step
A possible
next step will be to apply this same data collection program and landscape
planning on a larger and coarser regional scale—to examine the landscape
potential of the entire northern zone of Nuevo Leon, using virtually the same
analytical tools. A third step
will be the careful examination of appropriate forms of infrastructure for this
dry, sometimes harsh region. The specification of new roads and roadway designs,
new water conveyances, innovative energy generation and distribution systems, waste
(residuals) management systems, and many related issues will need to be
researched very carefully to determine which ones best apply to sustainable community design
and development in Rancho San Eduardo. Finally,
when the regional context and demand for such settlements is better understood
and the capability to make well-integrated decisions about land and water and
infrastructure systems to support a new settlement, then the time will be right
to begin the fourth step -- site planning and layout design of the settlement itself. Continue to |